![]()
Introduction: In the type II functional response, the rate of prey consumption by a predator rises as prey density increases, but eventually levels off at a plateau (or asymptote) at which the rate of consumption remains constant regardless of increases in prey density (see also TYPE I and TYPE III FUNCTIONAL RESPONSE). Holling's disk equation, named after experiments he performed in which a blindfolded assistant picked up sandpaper disks from a table, describes the type II functional response.
Importance: A consumer's functional response to changes in food density is an important component of population regulation. The type II response is the most common type of functional response and is well documented in empirical studies.
Question: Why does the functional response reach a plateau? What variable determines the level of the plateau?
Variables:
| Na | number of prey items attacked |
| aí | "attack rate" (searching efficiency) |
| N | prey density |
| P | predator density (usually one in experiments) |
| T | total available searching time |
| Th | handling time |
Methods: Holling's disk equation models the relationship between the number of prey items eaten during a period of time and prey density.
![]()
Na increases with the total time (T), prey density (N), and/or attack rate (aí), but decreases as handling time (Th) increases. Handling time is defined as the time spent pursuing, subduing, and consuming each prey item plus the time spent preparing to search for the next prey item (including effects of satiation).
Wiedenmann & OíNeil conducted laboratory experiments to measure the functional response of the predatory stinkbug Podisus maculiventris (Heteroptera) when exposed to six different densities of larvae of the Mexican bean beetle (Epilachna varivestis). Although P. maculiventris exhibited a type II functional response, predation rates measured in the laboratory differed noticeably from those measured in the field.
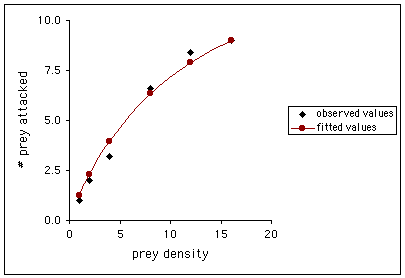
We can graph the observed number of Mexican bean beetles attacked by P. maculiventris as a function of bean beetle density, and plot the curve fitted using Holling's disk equation (T = 14 daylight hours; parameter estimates are aí = 0.0952, and Th = 0.90).

Interpretation: Holling explained the type II functional response as follows. There is a specific amount of handling time (Th) associated with each prey item eaten or attacked that is invariant to the density of the prey (N). Consequently, while prey items are easier to find as their density increases, handling time per prey item is the same, and the maximum number of prey items eaten or attacked is determined by the ratio of total available searching time to handling time (T/Th). In other words, at low prey densities (small N), a smaller proportion of a predatorís time is spent handling prey, even if the predator attacks every prey item available. As prey density increases and more prey are attacked, the proportion of time spent handling prey increases. This proportion reaches a maximum when all available time is spent handling prey (T = Th); at this point, handling time (Th), rather than prey availability, limits the number of prey items that a predator can consume (and consequently determines the level of the plateau).
Conclusions: Wiedenmann & OíNeil used Holling's disk equation to estimate the parameters Th and aí. Substituting these estimates and the known values for the other variables in the equation produced a curve that fit the laboratory data well, and they obtained an estimate of 15.5 for the maximum number of prey that could be attacked in a day. This estimate is much higher than that observed in field studies, where P. maculiventris only attacked an average of two bean beetles per day, even when beetles were abundant. The researchers point out that predators may have limitations in addition to handling time in field situations, and caution that functional responses determined in the laboratory may differ in maximum consumption rates, and even in the shape of the response curve, from those observed in the field.
Additional Question:
1. Holling's disk equation assumes that attack rates and handling times are independent of prey density, and that no significant reduction in prey density occurs. Are these reasonable assumptions? Under what circumstances could they be reasonable?
Sources: Begon, M., J. L. Harper, and C. R. Townsend. 1996. Ecology: Individuals, Populations, and Communities, 3rd edition. Blackwell Science Ltd., Cambridge, MA.
Holling, C. S. 1959. Some characteristics of simple types of predation and parasitism. Canadian Entomologist 91:385-398.
Southwood, T. R. E. 1978. Ecological Methods: With Particular Reference to the Study of Insect Populations. John Wiley & Sons, Inc., New York, NY.
Wiedenmann, R. N. and R. J. OíNeil. 1991. Laboratory measurement of the functional response of Podisus maculiventris (Say) (Heteroptera: Pentatomidae). Environmental Entomology 20(2):610-614.
copyright 1999 M. Beals, L. Gross, S. Harrell